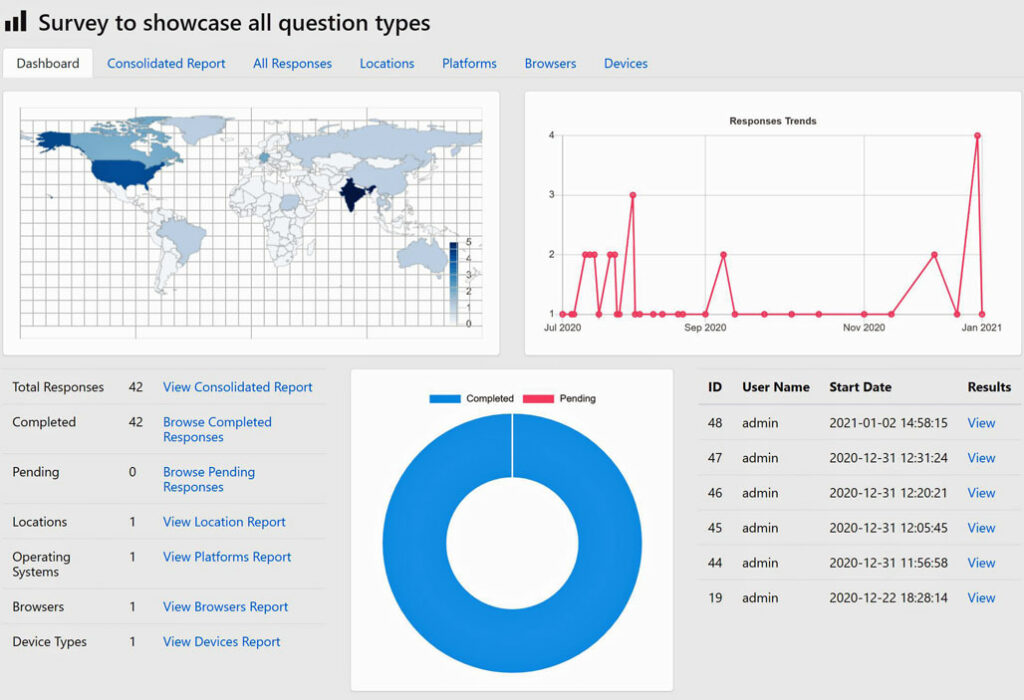
Reports Dashboard
Not just building the surveys, we have one of the most feature-rich reporting engines on NgSurvey.
Our NgSurvey dashboard shows you an overview of what is going on with your survey with real-time data.
See from which geo-locations your users are taking the survey, data-wise responses and how many pending or in progress responses, and so on.
The dashboard also gives you access to all quick links to see the most important reports and quick statistics.
Survey Listing Page
NgSurvey is well integrated with your WordPress custom post types, feel the same UX design of your favorite posts and pages.
Use your favorite Gutenberg editor to create the survey and its description.

Questions Form
Once you create your survey, add your entire questionnaire with our innovative Ajax-enabled form builder.
Manage all your questionnaire without leaving the page. Create, copy, move and delete just like you write a post.
Our advanced form builder lets you create simple to most complex surveys without much effort.

Question Details
Creating questions is now made simple with our advanced form builder. Question descriptions supports HTML editor.
All our question types are extremely customizable with built-in fields provided to add your own custom CSS class names.
Arranging questions between the pages is made simple with the quick buttons to copy and move the questions between pages.
All fields are neatly arranged to easily understand the layout and create the questions without any confusion. Explore the form builder now.
Unlimited Pages
Your imagination is only the limit. Create unlimited questions and arrange them in unlimited pages.
The pages tab allows you to quickly view the structure of your survey and arrange the pages with simple drag and drop operations.
Add meaningful titles to each page and add or delete them with simple one-click operations.

Conditional Rules
Not every survey is the same and not every person has the same view. So we built the most advanced conditional rules system which allows you to build the most complex surveys in minutes.
Create and manage all your conditional rules on the same page with our advanced rules builder.
Add multiple conditions, apply the operations and outcomes. It’s as easy as you write a post.

Consolidated Report
Want to know the overall feedback of all your questionnaire in a single place? Our consolidated report is the most advanced and complete report ever.
See the entire survey results neatly arranged in several charts, graphs, and statistics. When needed, you can quickly access the custom answers to your questions without leaving the page.
All your questions reports are neatly arranged in collapsible cards. When needed, expand all of them and take a print of them.

Response Details
Do you want to see what answers are given by your users? You can access each user’s detailed responses within our reports section.
The individual reports are shown in the same format the user responded to. So it is easy to understand and shows you the right details in the right manner.
All our question types are integrated with the responses report, so you can see all your data at one place.

Responses List
Keep track of all your user’s responses on the responses listing page.
The response listing page shows you the real-time status of each of your survey responses. You can quickly view each response detail without leaving the page.
You can find real-time response creation and completion time for each response from the listing page.
Using third-party software to analyze the data? Export all your survey responses in a CSV file with our CSV Download add-on and import them into your favorite software such as Microsoft Excel.

Locations Report
Find which geographic locations your users are responding to the surveys. With our Geo Location add-ons, capture user demographic details such as IP address, country, city, and state.
The locations report shows an overview of geo-locations on the charts. You can see the detailed statistics of each geo-location including city-level details (check the Geo Location add-on features for city-level support).
Location trends chart shows country-wise statistics on a bar graph for a quick overview.
Running an anonymous survey? You can choose to stop collecting user demographic information/IP details by choosing the survey as anonymous. NgSurvey will capture the user demographic details only when the survey is onymous.

Devices Report
Serve the right content to the right devices. Find which devices your users are using from our Devices report.
The devices report provides you detailed statistics about which devices, brands, and model names of your user devices. Search and filter the data and find take the right decisions on what type of content you can provide.
The device trends chart shows the trends over a period of time, what type of devices your users used to respond to the surveys. It is a great tool to find how a number of users using different device types. The trends are shown on a simple bar chart as well as a doughnut chart.
The device information is available across your other reports such as consolidated reports or the response details.

Platforms Report
Operating system details are the most critical information you may need when making decisions, especially for online service providers.
Our platforms report can capture detailed information about the user’s operating system details such as operating system name and version. You can find which version of an operating system is mostly used by your respondents using the quick statistics provided.
Our Platform Trends charts show you the user trends over a period of time. Find out the operating systems used by your user base over a period of your survey on bar and doughnut charts.
Operating system details are shared across other reports such as consolidated reports and response details reports.

Browsers Report
Browsers Report shows you the overview of what all browsers your respondents using. It shows detailed information such as browser name, browser version and browser Engine.
If you are designing your website, this crucial information will help you understand your user base.
The browser trends can be used to find the changing choices of your respondents and find what browsers are mostly used. The trends are shown on a simple bar chart as well as a doughnut chart.
The browser information is shared across your other reports such as consolidated report and response details report.

Survey Response
NgSurvey is not just awesome in helping you create the perfect surveys and showing you detailed reports but also has a user-friendly interface for your users to respond to the surveys.
The response form can be quickly shown to your users just the same way as your blog posts. Create a menu item for the survey category or survey itself. Or share the survey URL to your users over an email.
The survey form is customizable and each question and its elements can be styled with CSS styles. We use the Bootstrap framework to style the basic elements.
The survey form is Ajax-enabled, which means your users can take your entire survey spanned across multiple pages, without leaving the page. It’s the most user-friendly form and is responsive.
The survey form can remember the user responses of the multipage survey and load them back if the user leaves the survey and returns (when cookies, IP, user name or survey keys methods are enabled).
Would you like to maintain a user database and invite them to take your survey? Or would you like to invite all your registered users? Try our Campaigns add-on.

Survey Campaigns
Add survey campaigns feature with NgSurvey Extensions plugin. Campaigns allow you to create and manage your email lists and send survey invitations.
Unlimited contacts can be stored and they can be managed in unlimited lists. Campaigns can be easily sent to multiple email addresses using lists.
The campaign emails can be easily built by using the visual email editor. We have few beautiful email templates for you to start with your quick campaign.
The placeholders feature allows you to define constants for your website and easily insert them into all your campaign emails. You can create unlimited placeholders and insert them into the emails.

Front-end Management
Don’t want to give administrator access to your users and allow them to create surveys on their own? Front-end management allows you to do that. Simply assign survey author roles to your front-end users and they can start creating surveys on their own.
All features available for administrators are available on the front-end without losing your security.
Front-end management is a great feature if you are looking to monetize your surveys. Simply use any third-party membership component and give surveys creation access to your users for a fee.

Google Sheets Integration
Add one-click integration with Google Sheets and sync your survey responses in real-time. No need to check the backend reports every time, the responses are automatically synced with the connected Google Sheet as and when you receive a response to the survey.
Export the sheet as an Excel or CSV file and do your own analytics on your response data.

Feature Comparision
| Feature | Free Ver | Premium |
|---|---|---|
| Self-hosted Surveys with Full Control on Data | ✔ | ✔ |
| Advanced Form Builder | ✔ | ✔ |
| Answer Presets | ✔ | ✔ |
| Conditional Rules / Skip Logic | ✔ | ✔ |
| Unlimited Pages per Survey | ✔ | ✔ |
| Consolidated Report | ✔ | ✔ |
| Locations Report | ✔ | ✔ |
| Platforms Report | ✔ | ✔ |
| Browsers Report | ✔ | ✔ |
| Devices Report | ✔ | ✔ |
| Number of Question Types Available | 8 | 25 |
| Survey Campaigns, Invitations, and Tracking | ✔ | |
| Google Sheets Integration | ✔ | |
| Responses CSV Download | ✔ | |
| Send Email Notifications | ✔ | |
| WooCommerce & EDD Integration (Emails) | ✔ | |
| Frontend Survey Management | ✔ | |
| Capture User Location (Country, City) | ✔ | |
| reCAPTCHA Support | ✔ | |
| Import & Export Surveys | ✔ | |
| Premium Support (Forum & Email) | ✔ | |
| Download | Get Premium |